Dashboard: Origin's Built-in Dashboards and Chat Interface
Out-of-box Origin dashboards for security posture, AI usage, adoption, shadow AI, tools, and token spend, plus a free-form chat interface to query anything in the system.
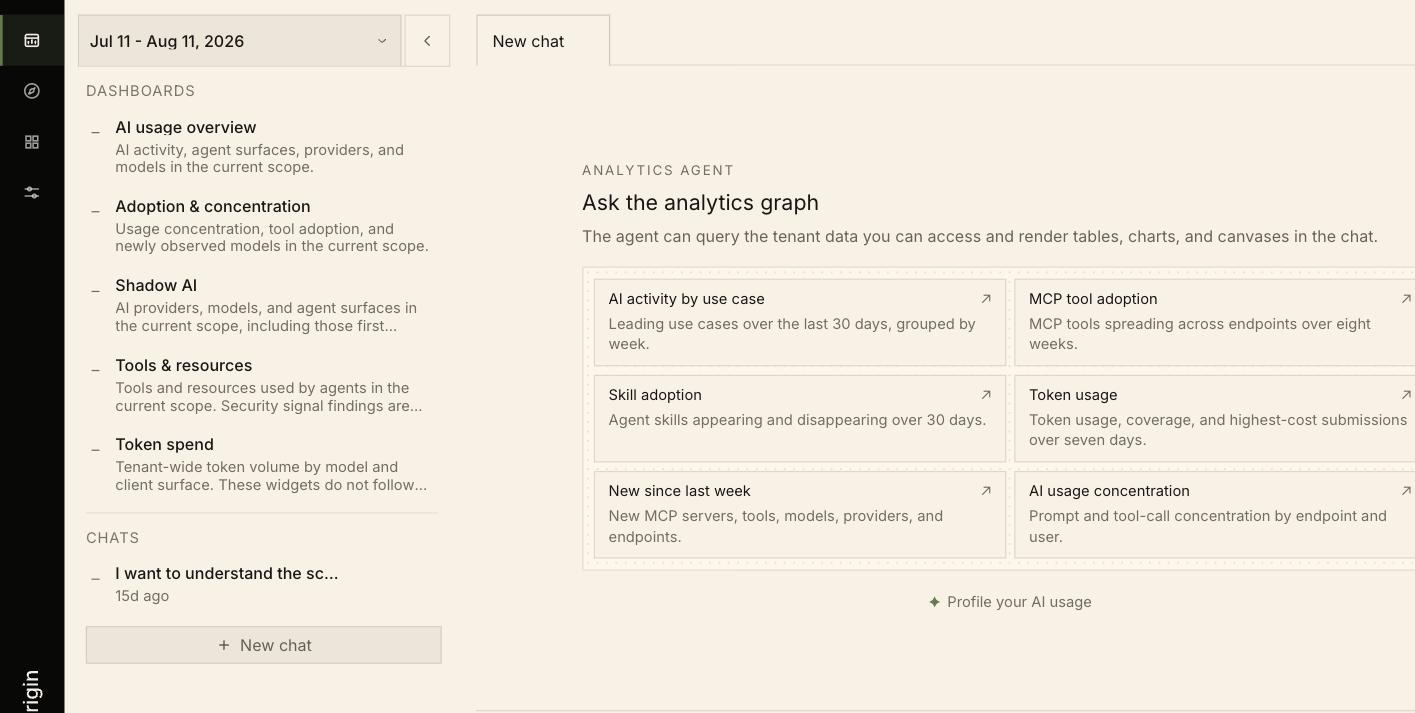
Dashboard is the first view in the icon rail — sometimes called the Analytics Graph, after the data model it queries. It has two halves: a set of out-of-box dashboards down the left, and a free-form chat interface that queries your tenant in plain language.
Six dashboards ship with the product, listed at the top of the left panel:
Dashboard
What it covers
Security posture
A CISO view of observed AI coverage, exposure, use, governance evidence, and policy enforcement gaps
AI usage overview
AI activity, agent surfaces, providers, and models in the current scope
Adoption & concentration
Usage concentration, tool adoption, and newly observed models
Shadow AI
AI providers, models, and agent surfaces in scope, including first-seen ones
Tools & resources
Tools and resources used by agents, with security signal findings
Token spend
Tenant-wide token volume by model and client surface
Most dashboards follow the current scope. Token spend does not — it reports tenant-wide figures and does not narrow when you scope in. For scoped cost, use the Token volume series on the Explore activity surface.
Dashboards are canvases. The same object appears as a tab in Explore rendered against your current scope, and is edited in the Library.
The chat interface queries the tenant data you can access and renders results as tables, charts, and canvases inline.Access is bound by your role — the agent only reaches data your grants already allow, so two people can legitimately get different answers to the same question. See Access Control.
Six starters sit on the empty state, each a real query you can run or edit:
Starter
What it asks
AI activity by use case
Leading use cases over the last 30 days, grouped by week
MCP tool adoption
MCP tools spreading across endpoints over eight weeks
Skill adoption
Agent skills appearing and disappearing over 30 days
Token usage
Token usage, coverage, and highest-cost submissions over seven days
New since last week
New MCP servers, tools, models, providers, and endpoints
AI usage concentration
Prompt and tool-call concentration by endpoint and user
Notice how specific the starters are — each names a window, a grouping, and often a rendering (“make the cluster cells clickable”, “build it as a canvas”). Questions phrased that way produce far better answers than open-ended ones, and you can ask for an interactive result or ask it to persist the answer as a canvas.
Profile your AI usage sits below the starters and tailors suggestions to what your organization actually does with AI.
Conversations are saved in the Chats list with a relative timestamp, so an investigation can be picked up later. New chat starts a fresh one, and chats open as tabs so several can run side by side.
⌘I
Assistant
Responses are generated using AI and may contain mistakes.