> ## Documentation Index
> Fetch the complete documentation index at: https://docs.originhq.com/llms.txt
> Use this file to discover all available pages before exploring further.
# Explore: Visual Analysis of AI Activity in Origin
> Explore visualizes AI activity across four sub-views (Overview, X-Ray, Anatomy, Canvases) with drill-down by agent, identity, endpoint, signals, and other attributes.
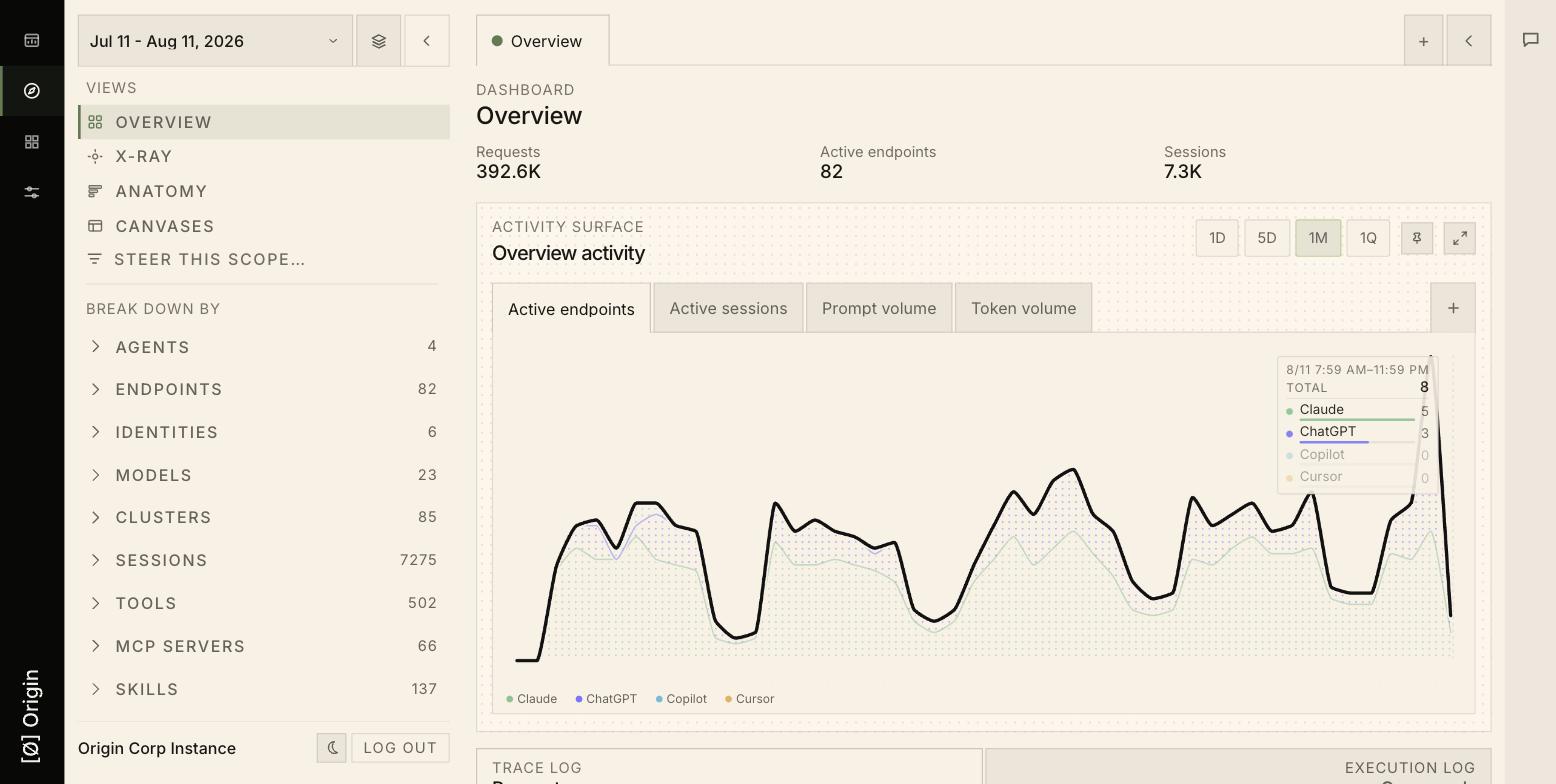
**Explore** is the visual exploration view. It has four sub-views down the left — Overview, X-Ray, Anatomy, and Canvases — and all four render against the current **scope**.
 ## Setting the scope
Three controls determine what the four views are looking at.
### Date range
The selector at the top left sets the window every view uses. If a view looks empty, check this first — a scope with no activity in the window renders as zeros, not as an error.
### Break down by
Below the view list, **Break down by** lists the nine entity types Origin tracks, each with a live count:
| Entity | What it is |
| --------------- | --------------------------------------------------------------------------------- |
| **Agents** | AI agent surfaces observed — Claude, ChatGPT, Copilot, Cursor |
| **Endpoints** | Managed devices reporting in |
| **Identities** | The people behind the activity, via your directory integration |
| **Models** | Specific models invoked |
| **Clusters** | Prompts grouped into topics |
| **Sessions** | A continuous unit of work — the unit of investigation |
| **Tools** | Individual tool calls made by agents |
| **MCP servers** | MCP servers agents connected to |
| **Skills** | Agent skills observed in the field |
| **Signals** | Detection signals that fired against prompts in scope — opens as an alert console |
Expanding one gives a searchable, sortable inventory. Sessions, for example, ranks by activity:
## Setting the scope
Three controls determine what the four views are looking at.
### Date range
The selector at the top left sets the window every view uses. If a view looks empty, check this first — a scope with no activity in the window renders as zeros, not as an error.
### Break down by
Below the view list, **Break down by** lists the nine entity types Origin tracks, each with a live count:
| Entity | What it is |
| --------------- | --------------------------------------------------------------------------------- |
| **Agents** | AI agent surfaces observed — Claude, ChatGPT, Copilot, Cursor |
| **Endpoints** | Managed devices reporting in |
| **Identities** | The people behind the activity, via your directory integration |
| **Models** | Specific models invoked |
| **Clusters** | Prompts grouped into topics |
| **Sessions** | A continuous unit of work — the unit of investigation |
| **Tools** | Individual tool calls made by agents |
| **MCP servers** | MCP servers agents connected to |
| **Skills** | Agent skills observed in the field |
| **Signals** | Detection signals that fired against prompts in scope — opens as an alert console |
Expanding one gives a searchable, sortable inventory. Sessions, for example, ranks by activity:
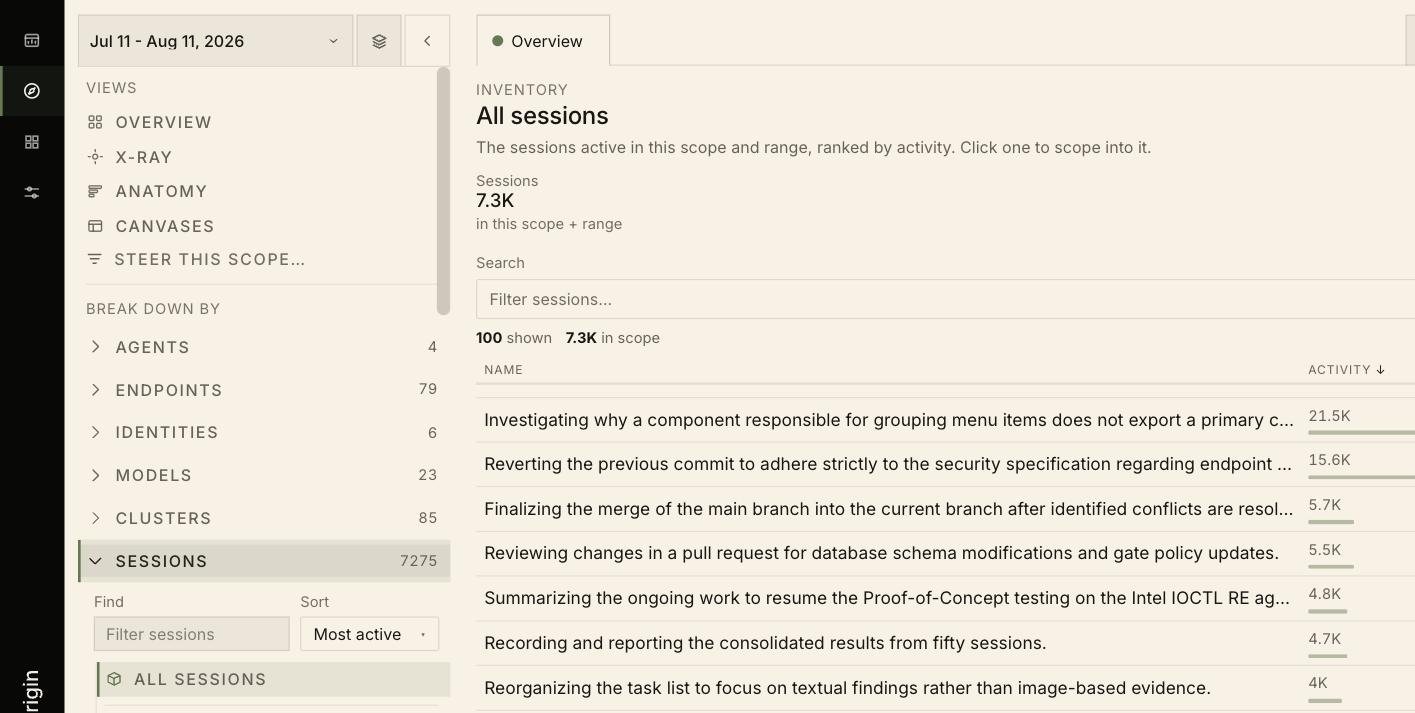 Clicking any row **scopes into it**. The breadcrumb updates, the headline counts drop to that slice, and all four views recalculate:
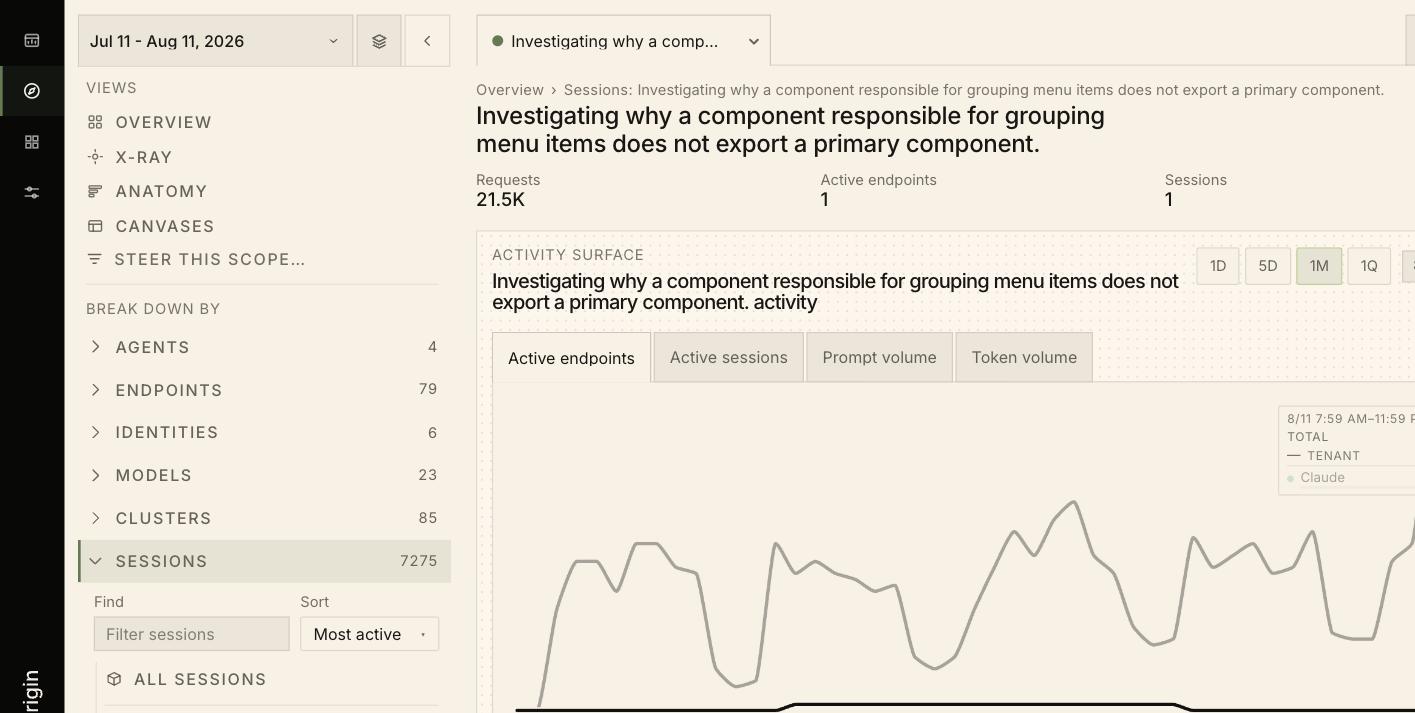 This is the core loop: break down by an entity, find the row you care about, scope into it, then read the four views.
### Steer this scope
**Steer this scope…** opens a filter builder for conditions you cannot express by clicking one row — **Match** (`ALL (AND)` or any), **+ Condition**, **+ Group** for nested logic, and a **Query** field showing the text form. **Apply** re-scopes; **Cancel** leaves it untouched.
## Overview
The default view. Three headline counts — **Requests**, **Active endpoints**, **Sessions** — sit above the **Activity surface** chart, which plots volume over time broken out by agent, with four series tabs:
* **Active endpoints** — how many machines were active
* **Active sessions** — how many units of work were running
* **Prompt volume** — raw prompt count
* **Token volume** — token throughput, the closest proxy for cost
Range buttons run **1D**, **5D**, **1M**, **1Q**, and up.
Switching between **Prompt volume** and **Token volume** is the quickest way to spot a few sessions consuming a disproportionate share of spend — a flat prompt line under a spiking token line means fewer, much larger requests.
### Request log
Below the chart, every request in scope, newest first:
This is the core loop: break down by an entity, find the row you care about, scope into it, then read the four views.
### Steer this scope
**Steer this scope…** opens a filter builder for conditions you cannot express by clicking one row — **Match** (`ALL (AND)` or any), **+ Condition**, **+ Group** for nested logic, and a **Query** field showing the text form. **Apply** re-scopes; **Cancel** leaves it untouched.
## Overview
The default view. Three headline counts — **Requests**, **Active endpoints**, **Sessions** — sit above the **Activity surface** chart, which plots volume over time broken out by agent, with four series tabs:
* **Active endpoints** — how many machines were active
* **Active sessions** — how many units of work were running
* **Prompt volume** — raw prompt count
* **Token volume** — token throughput, the closest proxy for cost
Range buttons run **1D**, **5D**, **1M**, **1Q**, and up.
Switching between **Prompt volume** and **Token volume** is the quickest way to spot a few sessions consuming a disproportionate share of spend — a flat prompt line under a spiking token line means fewer, much larger requests.
### Request log
Below the chart, every request in scope, newest first:
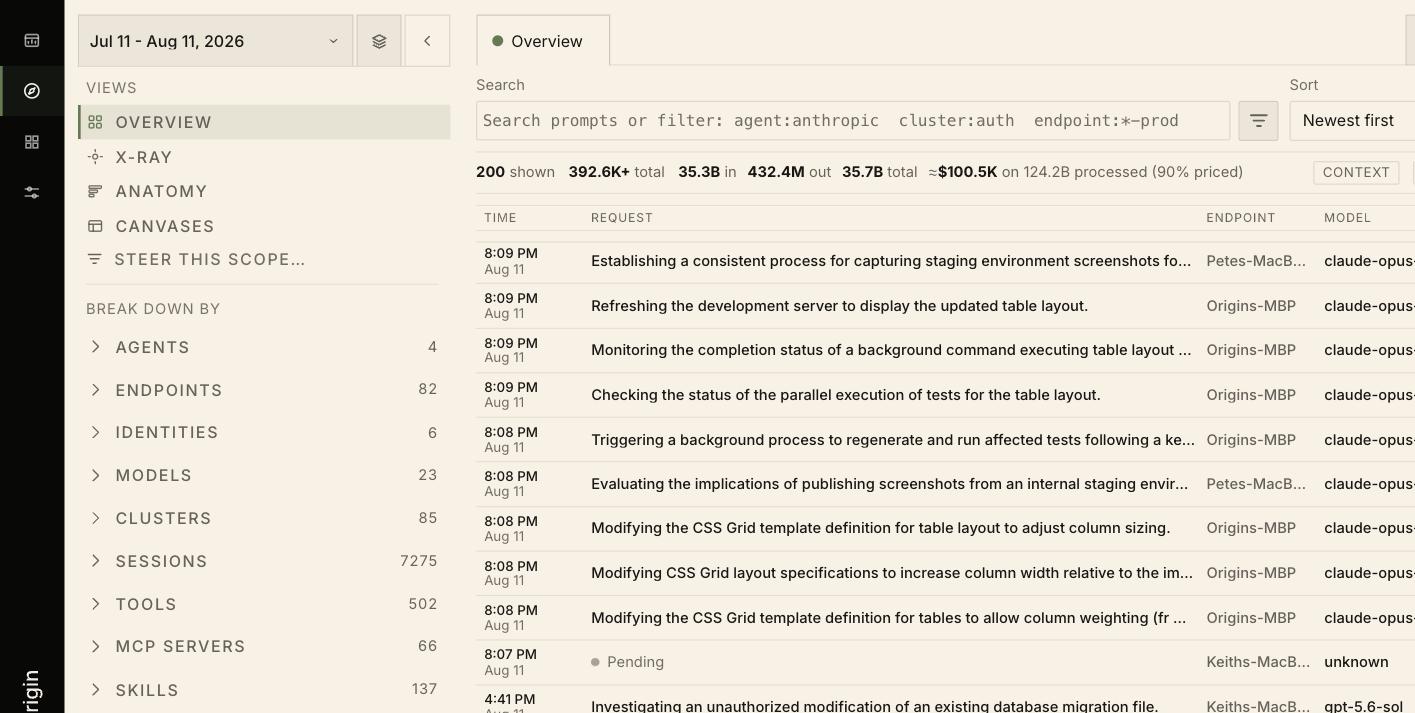 A totals line summarizes the whole scope, not just visible rows:
```text theme={null}
200 shown 392.6K+ total 35.3B in 432.4M out 35.7B total ≈$100.5K on 124.2B processed (90% priced)
```
The search box takes free text and field filters, with wildcards in values:
```text theme={null}
agent:anthropic cluster:auth endpoint:*-prod
```
Requests still in flight show as **Pending** with an `unknown` model until they resolve.
Log search filters the log only. To point every view at a narrower slice, change the scope instead.
## X-Ray
Overview tells you *how much*; X-Ray tells you *what it is about*, by reading prompt text in scope and rendering the language back.
A totals line summarizes the whole scope, not just visible rows:
```text theme={null}
200 shown 392.6K+ total 35.3B in 432.4M out 35.7B total ≈$100.5K on 124.2B processed (90% priced)
```
The search box takes free text and field filters, with wildcards in values:
```text theme={null}
agent:anthropic cluster:auth endpoint:*-prod
```
Requests still in flight show as **Pending** with an `unknown` model until they resolve.
Log search filters the log only. To point every view at a narrower slice, change the scope instead.
## X-Ray
Overview tells you *how much*; X-Ray tells you *what it is about*, by reading prompt text in scope and rendering the language back.
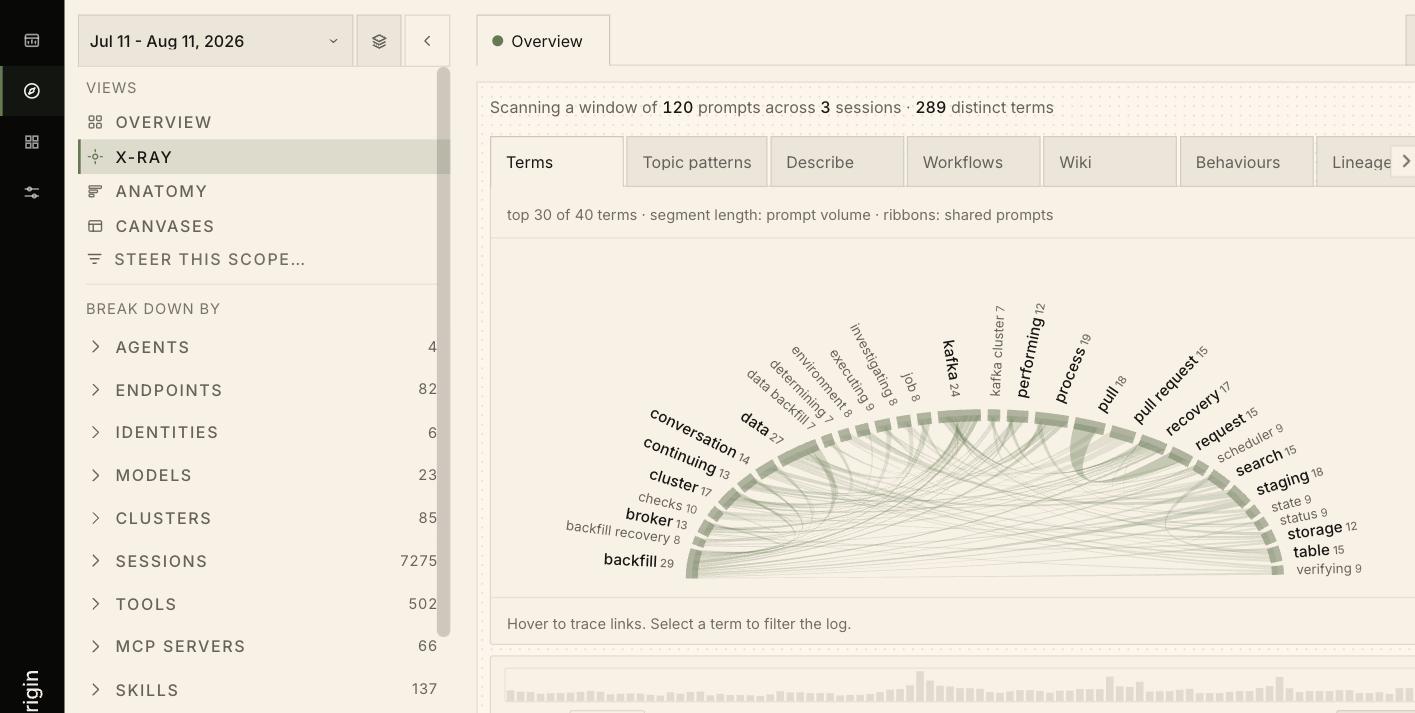 X-Ray reads a **sample**, not everything. The line above the tabs states exactly what it looked at — for example `Scanning a window of 120 prompts across 3 sessions · 289 distinct terms` — and a Sample control at the bottom sets the size and shows where the window sits in the total.
Tabs offer many different readings of that window — **Terms**, **Topic patterns**, **Describe**, **Workflows**, **Wiki**, **Behaviours**, **Lineage**, **Linear**, **Research**, **Git**, **Grafana**, **Queries**, **Recall**, **Artifacts**, **Live**, and **Secrets** — with an overflow menu (`···`) once there are more tabs than fit the strip.
On the default Terms tab, terms sit around an arc sized by frequency. Ribbons link terms that appeared in the same prompts, hovering traces one term's links, and selecting a term filters the log beneath to just those prompts — the bridge from "this topic is prominent" to "show me the requests".
X-Ray is most useful right after narrowing scope. Run it on the whole tenant and you get generic vocabulary; run it on one cluster, endpoint, or session and the terms become specific enough to act on.
## Anatomy
Anatomy answers "where does this activity actually sit" — the structure of the scope rather than its totals or its language.
X-Ray reads a **sample**, not everything. The line above the tabs states exactly what it looked at — for example `Scanning a window of 120 prompts across 3 sessions · 289 distinct terms` — and a Sample control at the bottom sets the size and shows where the window sits in the total.
Tabs offer many different readings of that window — **Terms**, **Topic patterns**, **Describe**, **Workflows**, **Wiki**, **Behaviours**, **Lineage**, **Linear**, **Research**, **Git**, **Grafana**, **Queries**, **Recall**, **Artifacts**, **Live**, and **Secrets** — with an overflow menu (`···`) once there are more tabs than fit the strip.
On the default Terms tab, terms sit around an arc sized by frequency. Ribbons link terms that appeared in the same prompts, hovering traces one term's links, and selecting a term filters the log beneath to just those prompts — the bridge from "this topic is prominent" to "show me the requests".
X-Ray is most useful right after narrowing scope. Run it on the whole tenant and you get generic vocabulary; run it on one cluster, endpoint, or session and the terms become specific enough to act on.
## Anatomy
Anatomy answers "where does this activity actually sit" — the structure of the scope rather than its totals or its language.
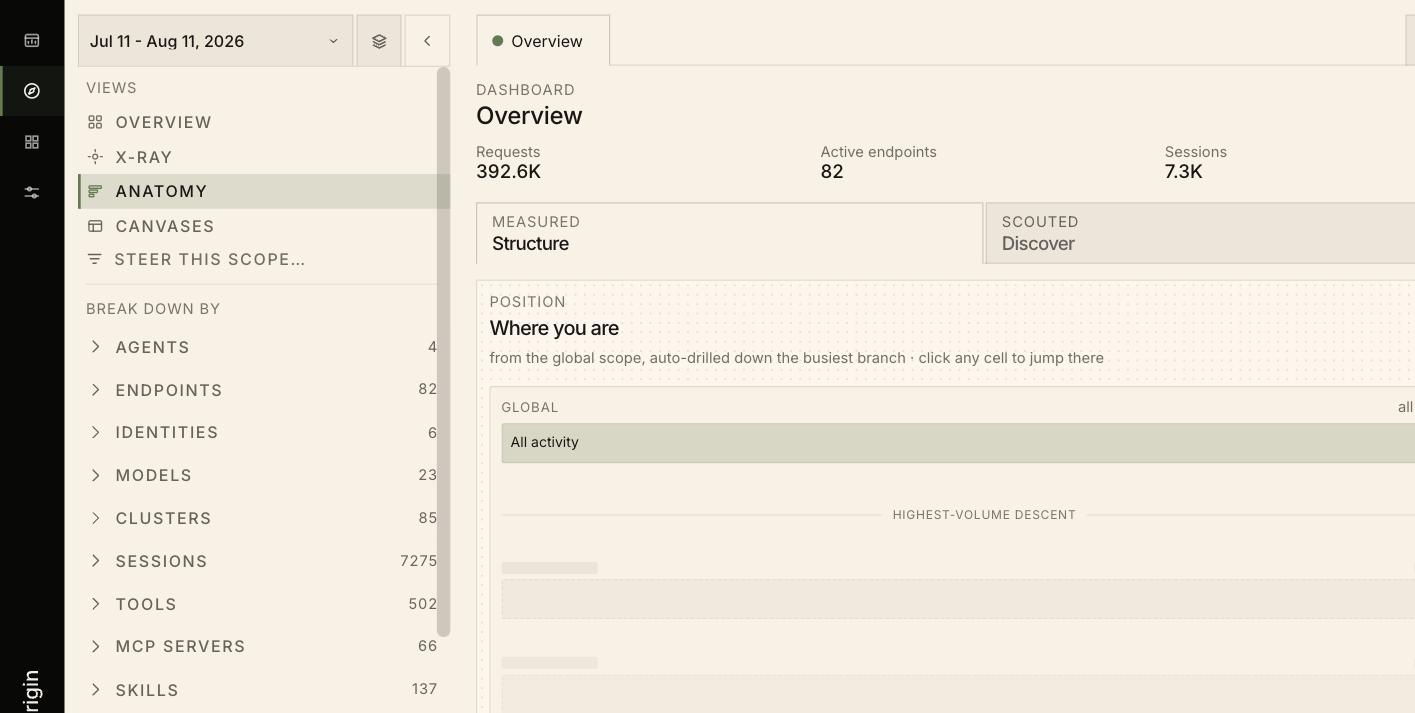 Two tabs split it: **Measured — Structure** (what Origin measured directly) and **Scouted — Discover** (what it scouted).
Under **Position**, the **Where you are** panel places the current scope in the hierarchy, starting at `GLOBAL · All activity`. Its caption describes what it did:
```text theme={null}
from the global scope, auto-drilled down the busiest branch · click any cell to jump there
```
Origin has already walked down the heaviest branch under **Highest-volume descent** rather than making you click through it. Every cell is clickable and re-scopes the console to that branch.
Below Position, a **Composition — What your organization runs on** section breaks the scope down by endpoint, identity, and agent, with a one-line concentration read — for example, *"Concentrated. `joe@originhq.com` drives \~66% of your organization. Likely one machine's workflow."*
## Canvases
Canvases are multi-widget views assembled from kernels, shown as tabs across the top:
Two tabs split it: **Measured — Structure** (what Origin measured directly) and **Scouted — Discover** (what it scouted).
Under **Position**, the **Where you are** panel places the current scope in the hierarchy, starting at `GLOBAL · All activity`. Its caption describes what it did:
```text theme={null}
from the global scope, auto-drilled down the busiest branch · click any cell to jump there
```
Origin has already walked down the heaviest branch under **Highest-volume descent** rather than making you click through it. Every cell is clickable and re-scopes the console to that branch.
Below Position, a **Composition — What your organization runs on** section breaks the scope down by endpoint, identity, and agent, with a one-line concentration read — for example, *"Concentrated. `joe@originhq.com` drives \~66% of your organization. Likely one machine's workflow."*
## Canvases
Canvases are multi-widget views assembled from kernels, shown as tabs across the top:
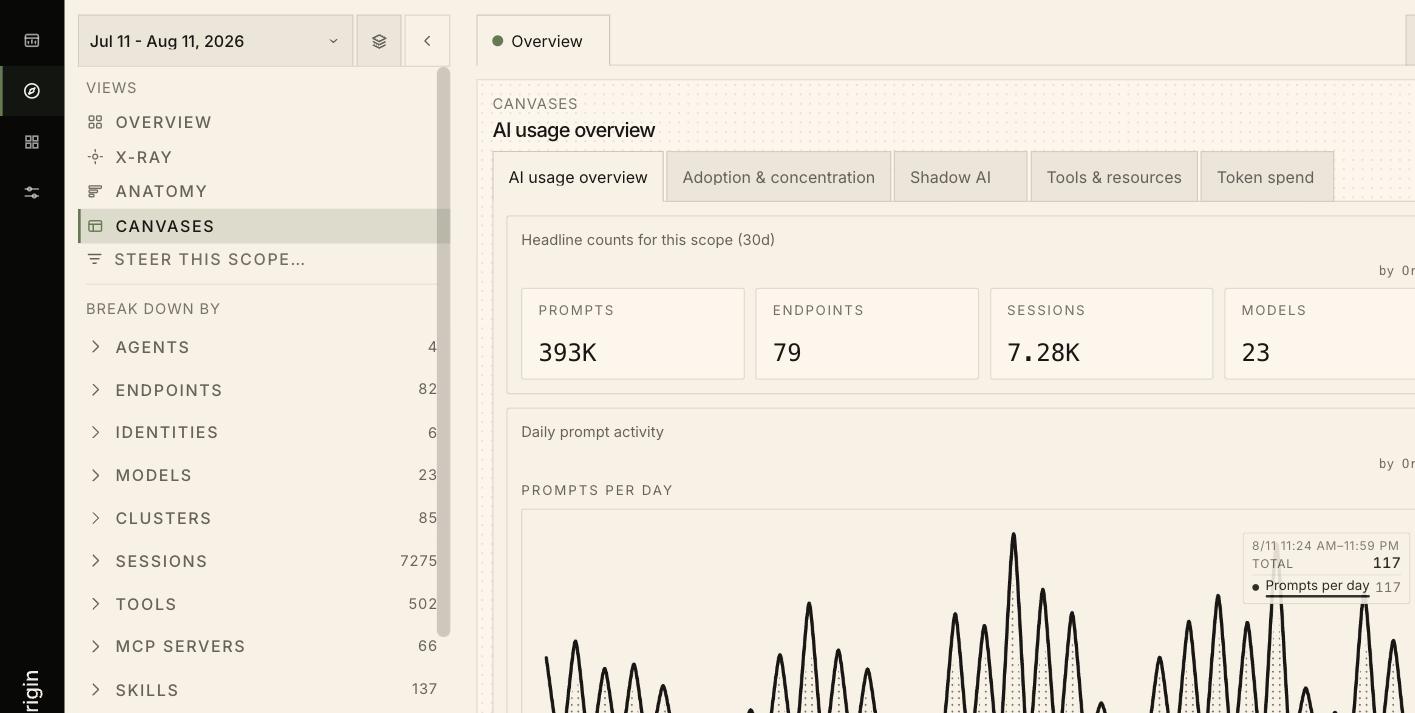 The six built-ins are the same objects as the dashboards in the [Dashboard](/walkthroughs/dashboards) view — **Security posture**, **AI usage overview**, **Adoption & concentration**, **Shadow AI**, **Tools & resources**, and **Token spend**. The difference is that here they render against whatever scope you have built.
Each canvas is a stack of widgets, and widgets are attributed — built-ins are labeled `by Origin`. To create or edit one, see the [Library](/walkthroughs/library).
The six built-ins are the same objects as the dashboards in the [Dashboard](/walkthroughs/dashboards) view — **Security posture**, **AI usage overview**, **Adoption & concentration**, **Shadow AI**, **Tools & resources**, and **Token spend**. The difference is that here they render against whatever scope you have built.
Each canvas is a stack of widgets, and widgets are attributed — built-ins are labeled `by Origin`. To create or edit one, see the [Library](/walkthroughs/library).